By Jay Jung · Reviewed 1 September 2026
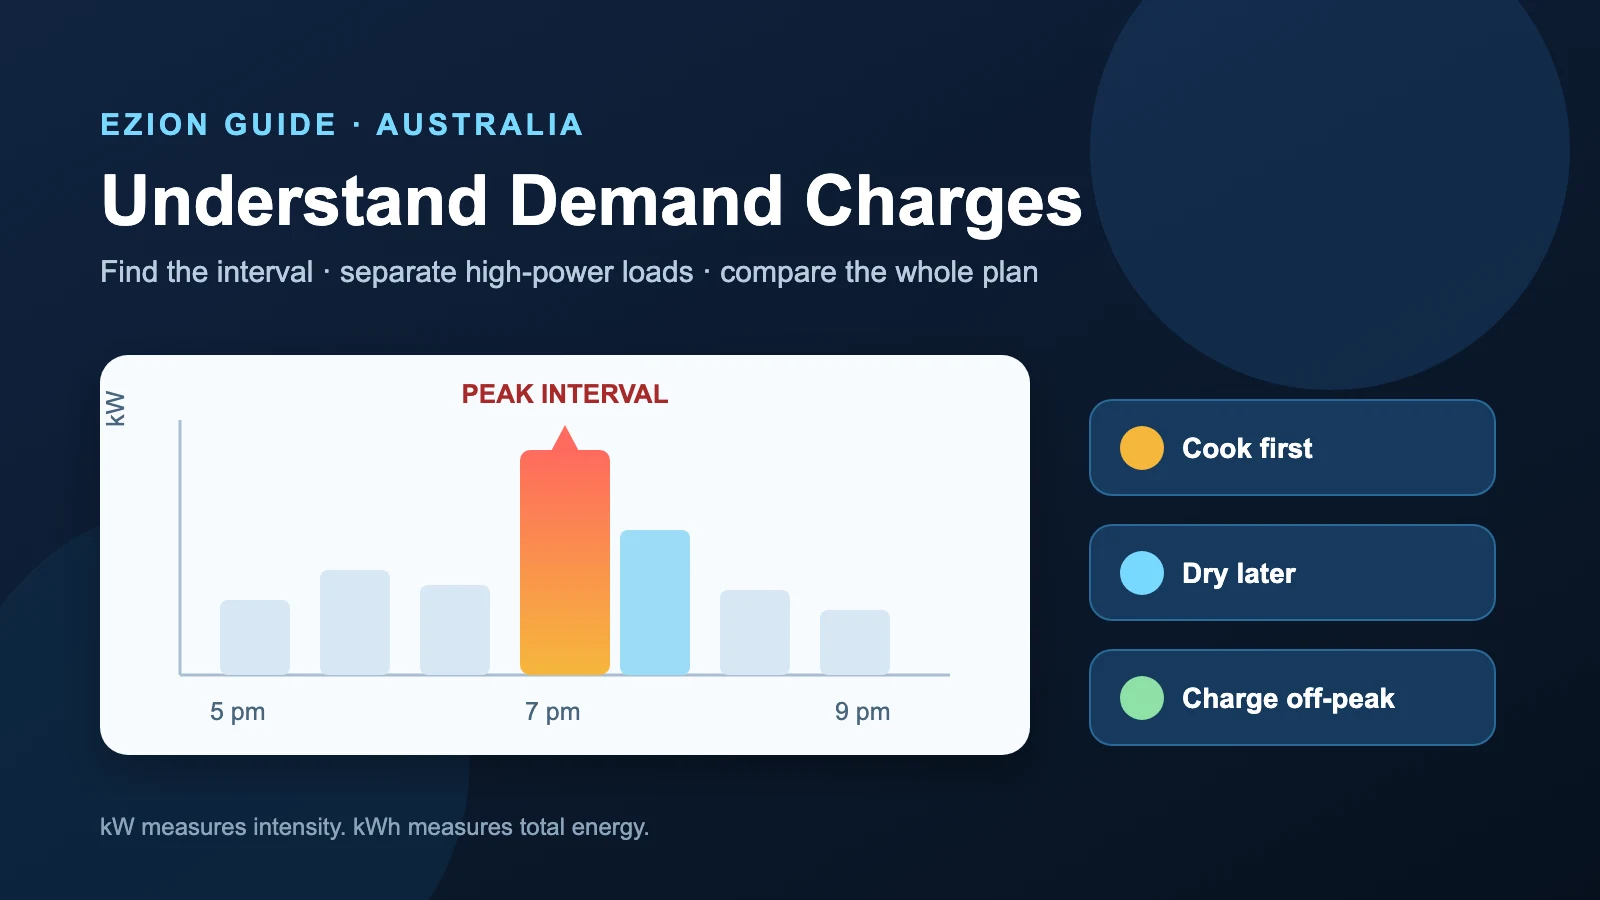
A demand tariff can make one busy half-hour matter more than many quiet hours. A household may use less electricity than last month yet receive a higher bill because the oven, cooktop, air conditioner, clothes dryer and EV charger overlapped inside the plan’s demand window. The extra line is not another price per kilowatt-hour. It is a charge linked to how intensely the home drew power, measured in kilowatts.
This guide explains how to identify a residential demand charge, reconstruct the interval that set it, compare the full plan and reduce avoidable peaks without compromising safety or comfort. For broader tariff choices, start with our time-of-use versus flat tariff guide. To read every bill line, use the electricity bill guide. If a recent meter change raised questions about consent or data, see the Australian smart-meter guide.
Read your own plan: Retailers and distributors can use different demand windows, seasons, interval lengths, rates, minimums and calculation methods. Examples below teach the method; they are not quoted prices or a promise of savings. Confirm the current Basic Plan Information Document, bill and written retailer explanation for your address.
This is general household information, not financial, electrical or legal advice. It contains no affiliate links and does not guarantee a lower bill. Do not switch off medical, refrigeration, ventilation or safety equipment to chase a demand target, and use a licensed electrician for fixed wiring or controlled-load changes.
Demand is not the same as energy
Energy consumption is the total electricity used over time, measured in kilowatt-hours (kWh). Demand is the rate at which the home uses electricity during a defined interval, measured in kilowatts (kW). Think of kWh as the water used over a day and kW as how fast the water flowed during the busiest interval.
For a 30-minute interval, a simple conversion is:
Demand in kW = electricity used in that half-hour in kWh × 2.
If the meter records 3 kWh between 6:00 pm and 6:30 pm, the average demand for that interval is 6 kW. That does not mean every appliance drew exactly 6 kW at every second. Brief starts and stops are averaged across the interval. A short hair-dryer use may have less effect than a lower-powered appliance that runs through most of the half-hour.
Energy Made Easy says demand plans normally retain supply and usage charges and add a demand charge. A plan may use the highest interval in a month, an average of selected peaks, seasonal rates or another defined method. Never assume the formula from a neighbour’s bill applies to yours.
Find the five facts that control the charge
Before changing household routines, find these facts on the bill, contract, Basic Plan Information Document or retailer portal:
- Measurement unit: Is demand shown in kW or another unit?
- Interval: Does the plan use 30-minute, 15-minute or another interval?
- Window: Which hours, weekdays, weekends and public holidays can set the charge?
- Season: Does the demand window or rate change across summer, winter or low-season months?
- Formula: Is the bill based on one monthly maximum, several peaks, a minimum demand or a daily rate multiplied across the billing period?
Also separate the network tariff from the retail plan. The Australian Energy Regulator explains that distributors charge network tariffs to retailers, but retailers package network, wholesale and other costs into offers. Your retail demand window and rate may therefore differ from the distributor’s published network tariff. The retailer’s current document and bill control what you pay.
Reconstruct the half-hour that set your bill
Start with the demand quantity printed on the bill. Then download interval data from the retailer or meter-data portal for the billing period. Filter it to the plan’s eligible demand days and times. If the data is in kWh per 30 minutes, multiply each eligible interval by two and sort from highest to lowest.
For example, suppose the highest eligible interval used 2.8 kWh. Its average demand is 5.6 kW. If the retail plan charges a stated daily amount per kW and applies the recorded maximum across every day in the billing period, the demand component will reflect that 5.6 kW and the plan’s day count. Some plans instead quote dollars per kW per month or use another calculation. Apply only the formula printed for your offer.
Match the winning interval to what happened at home. Look for overlapping high-power loads: electric cooking, space heating or cooling, resistance hot water, a dryer, pool equipment or EV charging. The useful question is not “which appliance uses the most energy all month?” It is “which appliances overlapped during the interval that set demand?”
Keep the raw data and a screenshot of the tariff terms. If your calculation does not match the bill, ask the retailer to identify the exact date, interval, measured demand, rate and multiplier. A clear interval makes a billing review much more specific.
Why one peak can follow you through the month
Many residential demand plans use the highest eligible interval to set the demand quantity for a billing month. One unusually busy dinner period can therefore affect the whole monthly demand component even if later evenings are careful. Reducing total kWh after the event may lower usage charges but will not necessarily undo the peak already recorded.
This is why demand management works differently from ordinary energy saving. Turning off lights helps consumption, but it may barely change a peak created by an oven, cooktop, air conditioner and charger. The strongest response is usually to prevent high-power equipment from running together inside the measured window.
The exact risk changes by place and offer. Ausgrid, for example, publishes seasonal network windows but warns that retailers may adopt different windows. Energy Made Easy likewise notes that plans can use a highest demand, an average of peak demand or different seasonal rates. These examples prove why address-specific documents matter; they are not national schedules.
Reduce peaks by sequencing, not by going without
Make one change at a time, starting with flexible loads:
- Finish electric cooking before starting the dryer or dishwasher.
- Schedule an EV charger, pool pump or dishwasher outside the demand window where the appliance and plan allow it.
- Avoid reheating water, charging a vehicle and running resistance heating together.
- Pre-heat or pre-cool moderately before the peak window when weather, comfort and equipment controls make that sensible; do not create unsafe indoor temperatures.
- Use built-in delay-start and energy-management controls rather than unverified plug-in timers on high-power appliances.
- If two flexible loads must run in the window, place them in separate billing intervals and verify the meter’s clock boundaries.
Do not obsess over tiny standby loads while several kilowatts overlap. Start with fixed-wired heating, cooling, cooking, hot water, pool equipment and vehicle charging. Manufacturer labels give a clue, but interval data shows what actually reached the meter.
Controlled-load or economy tariffs may isolate eligible equipment such as hot water from the primary tariff in some areas and offers. That arrangement needs suitable metering and often electrical work. Ask the retailer how controlled-load consumption affects demand under the specific retail plan before paying for a wiring change.
Solar and batteries do not automatically remove demand charges
Rooftop solar can reduce grid imports while it is generating, but many household demand windows extend into late afternoon or evening as solar output falls. A cloudy interval can also produce a higher import than expected. Compare import interval data, not the solar app’s generation graph alone.
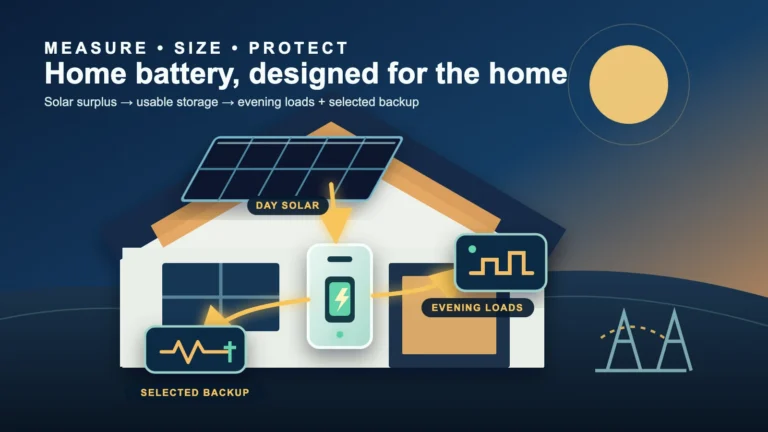
A home battery may support the house during a demand window, but its result depends on available state of charge, inverter output, reserve settings, control strategy and household load. A battery that is empty, preserving backup reserve or limited to a lower power output may still allow a grid peak. Do not buy storage solely from one demand-charge example; compare full installed cost, warranty, expected cycling, tariff rules and alternative retail plans.
Similarly, an EV can be a flexible load when charging is scheduled, but an unscheduled 7 kW-class charger can dominate a household interval. Check charger settings, vehicle departure needs, circuit capacity, retailer windows and any solar-charging mode. Fixed charger changes belong with a licensed electrician.
Compare the whole annual plan
A lower demand rate does not automatically make an offer cheaper. Compare supply charges, all usage rates, controlled-load rates, solar credits, fees, conditional discounts and the demand formula together. Use at least several representative months of interval data, including hot and cold seasons, because household peaks and seasonal windows change.
For National Electricity Market regions covered by Energy Made Easy, upload or enter recent bill information and inspect each offer’s plan document. Victoria uses Victorian Energy Compare; Western Australia, the Northern Territory and regional Queensland have different market arrangements and government information. A national article cannot tell every address which plan is available.
Model a conservative scenario as well as the recent past. Ask what happens if everyone is home during a heatwave, an EV arrives, gas appliances are electrified or work-from-home patterns change. A plan that wins only when the household maintains a delicate schedule may not be the best practical choice.
Know the smart-meter protection boundary
For Queensland, New South Wales, South Australia, Tasmania and the ACT, the AER says the retailer that installs a smart meter must seek consent before changing the tariff structure for two years after installation. The protection does not apply in the same way if you change retailer, and Victoria has its own regulatory framework. The AER also says retailers in Queensland and South Australia must offer a flat-rate plan to smart-meter customers, with a similar requirement applying to some ACT retailers.
These protections are specific and should not be stretched into a nationwide right to refuse every demand offer. Keep installation notices and plan-change communications. Ask the retailer to confirm whether the change is a price change within the same structure or a change from flat, time-of-use or demand structure. If a dispute remains after the retailer’s complaint process, contact the energy ombudsman for your state or territory.
A practical first-week checklist
- Circle every supply, usage, controlled-load, solar and demand line on the latest bill.
- Obtain the current plan document and write down the demand interval, window, season, rate and formula.
- Download interval data for the exact billing dates.
- Identify the highest eligible intervals and match them to household activity.
- Move or sequence one or two flexible high-power loads.
- Check the next portal data before assuming the change worked.
- Compare the full annual cost of alternative offers, not one headline rate.
- Keep safety, medical needs and reasonable comfort above tariff optimisation.
A demand tariff becomes manageable once it stops being a mysterious line and becomes a traceable interval. Find the rule, find the interval, identify the overlap, then decide whether changing the routine or changing the plan is the simpler response.